
How to calculate the cost of wrong hire?
The Synopsis
A leading home loan provider approached QP for analytics on their frontline performance. They were facing severe challenges with attrition, especially of their off-role employees in the system. Despite a strong brand and steady business growth in the housing market, the company was struggling to bring in employees who could stay and perform consistently during their tenure. Their recruitment team had an excellent turnaround time, but the quality of hires and incumbents’ ability to deliver was inconsistent. They wanted to understand what truly defined a “dream employee” in their context and how to replicate that profile in future hires.
The Challenge
Attrition was one of the biggest challenges in the organisation. The problem was compounded by:
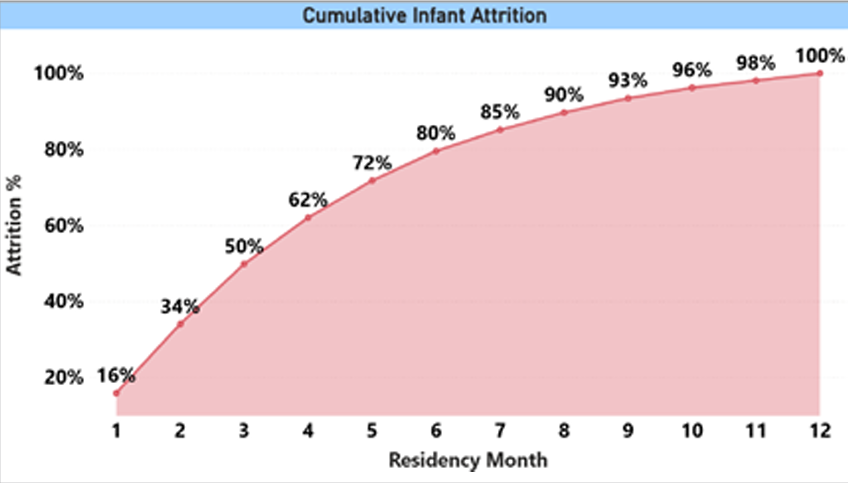
- High infant attrition and low productivity: Many new hires were leaving within the first 6 months, and the average tenure of an employee in the last 2 years was only 3.8 months. The infant attrition was very high at 80% and 25% of the employees were zero performers from their month of joining till their month of exit.
- High cost of wrong hire: Each wrong hire was a loss of revenue and opportunity because the attriting employees consistently underperformed. The cost of one refill only due to underperformance (and not considering hiring, BGV and training costs) was ₹89,463.
The company needed a way to go beyond resumes and to scientifically identify who would thrive in their organisation.
The Solution
QP deployed its patented TMI Plot to identify the “dream employees”. The definition of a dream employee was established, and candidates were filtered when they matched this success profile. The process was executed through:
- Data Mapping: Collected demographic data such as age, gender, experience, past relevant experience, educational qualification, resume source, geography, supervisor details and the performance data of the dream employees.
- Pattern Discovery: We identified key demographic traits that had a strong correlation with those of the dream employees.
- Actionable hiring blueprint: We converted these insights into a hiring scorecard, enabling recruiters to filter candidates who closely matched the success profile while avoiding those with high-risk traits.
QP worked closely with the data analytics team at the client’s organisation to lay down insights and bucketed the attributes into must-haves, desirable and clear rejects. For instance, QP’s analysis between Jan 2023 to Dec 2024 revealed that non-graduate hires consistently underperformed. This insight was shared with the data science team at the client’s location, who validated the pattern against historical data of 5 years. As a result, non-graduates were classified under the clear-reject category, ensuring the hiring funnel filtered out such candidates at the early stages.
The Impact
The implementation of this strategy commenced in May 2025. While the outcomes are yet to be established, early signs are promising. The client reported an optimised funnel ratio, reducing screening time and improving the quality of incoming resumes. The early trends suggest that the approach is reshaping the hiring pipeline and laying the foundation for measurable long-term impact.
To know more contact Akshita Jai Kumar (7032642609) or Srinath Santhanam (8939836636).